The PlanMinder Manual - 05 Kairos
This is one chapter from the manual. Access the full manual here.
Kairos
▶ Video reference Manager @ 0:37Overview
On this page you create and edit project plans. You need to have Manager or Admin privileges to edit and create plans, but all users can view the plans. As a developer you can edit activities you are responsible for in this view.
Kairos is an ancient Greek word for the opportune time for something. Different from the word chronos, as in chronometer, that is the word for time as on a timeline.
Project plans in The PlanMinder describes when an activity should be done in relation to other activities and milestones. The dependencies are marked with lines.
You read the plan from top to bottom. A circle with no lines connected to its top represents an activity that can be started at any time. If it has a connection, the activity it is connected to must be completed first.
A filled circle is an activity with remaining work. Unfilled mean that it has been completed.
There should be at least one milestone in the plan marked as a prio point with three yellow circles. Only activities directly or indirectly connected to a prio point will be scheduled. The prio points will appear on the Prio list page.
There can also be start points, external activities, discrete risks, deadlines and checkpoints in your plans.
When you have created or changed a plan you click on the Run Scheduler button to let The PlanMinder schedule all the tasks. You can run the scheduler every day to take into account changes in how much people actually work, updated estimates, changes in other project plans, changes in team member availability, etc. without having to touch your plan in Kairos view. And yet you will always have a plan and a schedule that is up to date.
Monitor the schedule and the calculated probabilities for milestones, deadlines, resource utilization, and optimize your plan when necessary.
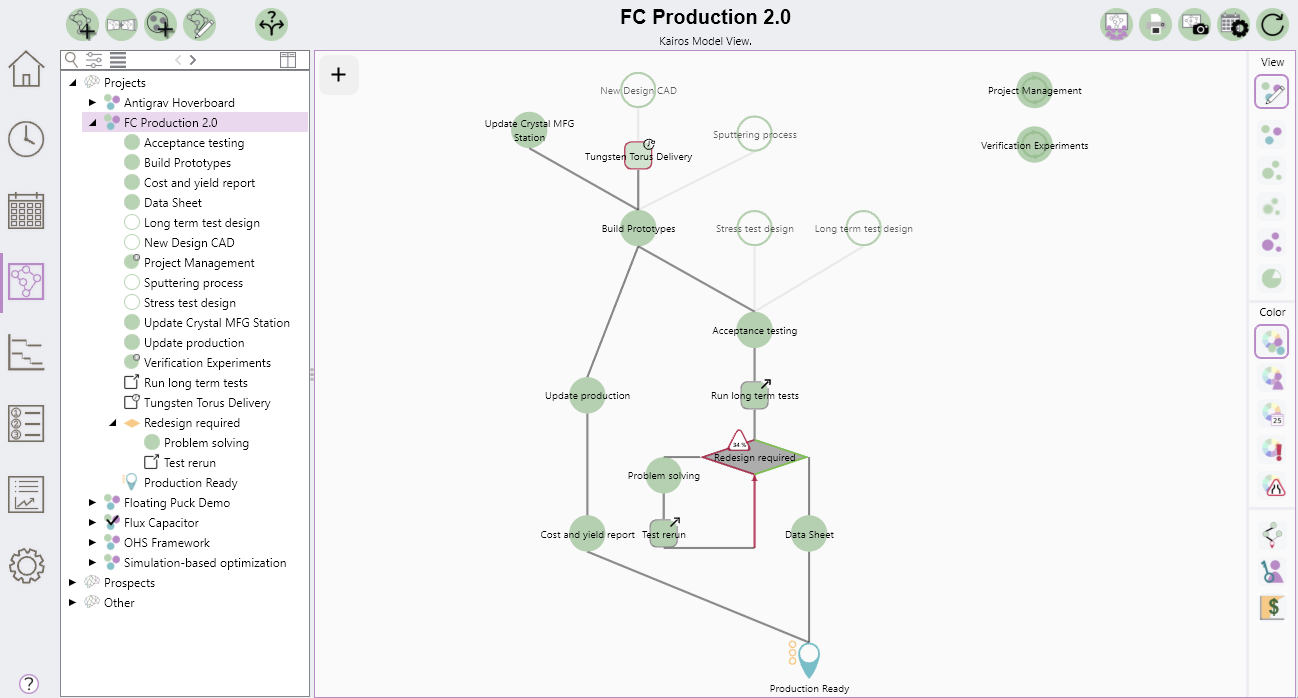
The example project in the screenshot is from the demo. A short explanation of what you see:
The blue milestone at the bottom, “Production Ready”, is marked as a prio-point. All activities linked to it must be completed to reach the milestone. At the top, you see that some activities are already completed. Right now, the only activity we can work on is “Update Crystal MFG Station”. “Tungsten Torus Delivery” is an external activity where we wait for a part to be delivered. The clock symbol shows that the part has been ordered, which is possible because “New Design CAD” is complete. We need both of these to start the “Build Prototypes” activity, and we need the prototypes to do the “Acceptance Testing”.
There is a risk symbol in the plan “Redesign Required”. It represents the 34% risk that our prototypes will not pass acceptance testing without some kind of redesign. If this does happen, we would need to complete the “Problem-solving” activity, and do a re-run of the long term tests. Otherwise we can go directly to the “Data Sheet” activity.
On the right side, there are two ongoing activities. “Project Management” is a typical ongoing activity. We know it will take some time, but we cannot schedule it to be completed all in one go.
Creating a project
 To create a new project click on the New Project button in the top left. This will bring up a dialog window where you enter basic information about the project.
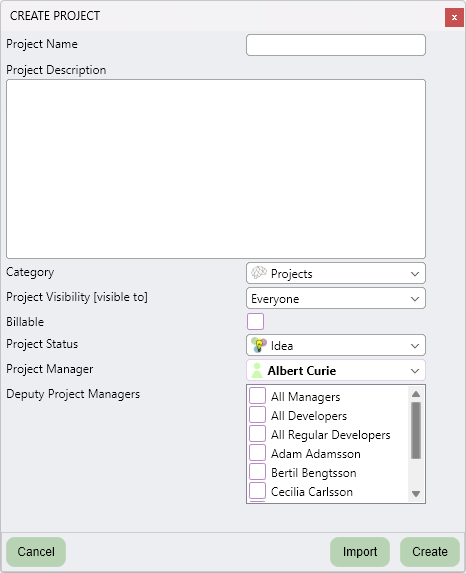
Enter a name and a description for the project. The project will by default be created in the active category, but you can select a different category in the drop down list.
Normally Project Visibility should be set to Everyone, but sometimes you may have a reason to not let the project appear in all users project tree.
- Regulars: Show only to users marked as regular, and to users with responsibilities in the project.
- Need to know: Show only to users with responsibilities in the project.
- Admin: Show only to administrators.
Billable defines the default value for the billable flag, if used.
Project Manager defines who is responsible for managing this project. Only users marked as managers can be selected.
You can optionally add Deputy Project Managers. They will be allowed to edit the project the same way the Project Manager can. You can designate specific persons, or all users with specific privileges. Users set as Administrators can always edit all projects.
Project status is described in detail below.
Cloning a project
 You can create a project using another project as a template with the Clone Active Project button. You must first open the project you wish to clone. When cloning a project all activities and other elements with their settings are copied to a new project, but not the project history.
The Import button in the Create Project dialog lets you create a project from a clone saved to file. The Clone Project dialog has an Export button that lets you save a project as a template (.tpmt) file. See also Working with templates.
Template files are mainly useful when you want to use a project template from a different database. If you want to create templates for your own team, you can set up a Category for template projects to clone when needed.
Editing project information
 To edit a project, select it and click the Edit Project button. This brings up the same dialog options as when creating a project. Make sure View Mode (on the right side) is set to edit mode. Otherwise you will not be allowed to edit.
If you wish to move a project from one category to another, you can also do so by drag and drop in the tree view.
Enter Scenario Mode
 This button will allow you to enter Scenario Mode. Scenario Mode lets you create and test different scenarios where you can change projects and priorities without affecting the active plan. The Scenario Mode is described in its own chapter below.
Project status
A project can have one of seven different statuses. They are defined as follows:
 Idea: It is a project idea. The project is not scheduled, changes are not tracked and you can not report time on this project.
 Planned: The project is planned, but has not yet started. It is not scheduled, but it is possible to report time on the activities. Changes to activities will generate an Update entry visible in the project history.
 Active: The project is active, and is scheduled.
 Paused: The project is paused, and is not scheduled. It is understood that the status will be changed back to active some time in the future. Functionally similar to planned.
 Completed: The project has been completed, and is no longer scheduled. It is still possible to report time on this project.
 Ongoing: This is not a real project with a defined end. It is instead a grouping of ongoing activities. It is possible to add prio points and schedule activities in an ongoing project, but it is mainly intended to be used to host activities to report non project time on.
 Closed: The final state of a project. Not scheduled and no longer possible to report time on.
The normal project life cycle should be Idea → Planned → Active → Completed → Closed. Let the project be in the Idea state until you believe the plan is ready. This will avoid filling up the project history with Update entries.
Deleting a project
If a project is empty the edit dialog will have a Delete button allowing you to permanently delete the project. A non-empty project is deliberatly a bit more complicated to delete, to prevent you from accidentilly lose valuable data. When the project status is set to Closed, it is possible to either anonymize data related to the project, or completely delete everything using the function Handle Project Data in the Settings / Manage Data tab.
The project tree view
On the left side you have the project tree view. This is a hierarchical view of projects and activities and everything that makes up a project plan.
The top level categories are defined on a settings page. They appear in the order they are defined.
The next level are the projects. Activities and other elements are inside projects. They are sorted by type and by name in alphabetical order. You can double click on an element in the tree view to bring up its corresponding edit dialog. Selecting an element in the active project will also select it in the Kairos view to the right, ping it to show where it is, and pan to it if it is not already visible in the window.
These are symbols you can find in the project tree:
 Category: Top level grouping of projects.
Project: May be shown with any of the status icons listed above.
 Group: A group of avtivities and milestones.
 Start point: A date before which work on dependent activities can not start. The symbol is grey if the date has passed.
Activity icons:
 Activity.
 Activity completed.
 Activity completed, but with risk for remaining unscheduled work.
 Ongoing unscheduled activity.
 Hidden activity.
Milestone icons:
 Milestone.
 Milestone that has been reached. Can also be red for a reached deadline.
 Milestone that is a prio point. Can be red for a prio point that also is a deadline.
 Milestone that is a deadline.
 A missed deadline.
 Checkpoint.
 Checkpoint not yet reached, but approved.
 Checkpoint reached, but not yet approved.
 Checkpoint reached and approved.
External activities:
 External activity.
 External activity, started and awaiting delivery.
 External activity, completed.
Discrete risks
 Discrete risk, pending
 Discrete risk, resolved as OK.
 Discrete risk, resolved as fail.
A warning symbol can be added to projects, groups and activities to indicate a scheduling problem. Click on the warning triangle on the Run Scheduler button to list all problems.
Tree view tools
Above the tree view is a tool panel with four icons.
 Search: Click the search icon to bring up the text search tool. Type text in the text field to search for the name of an element in the tree view. Select search mode on the right side to match beginning of names, or anywhere in names.

If the search term does not match any name, the text field gets a red frame. Click the up and down arrow buttons to jump between matches in the project tree.
 Filter: The tree view can be filtered to not show projects of selected statuses, and to not show activities marked as hidden. By default closed projects and hidden activities are not shown. Check all boxes to show everything.
 Striped background: Toggles a striped background for the tree view.
 Increase / Decrease width: Changes the width for names in the tree view.
 Show columns: Select predefined sets of columns with information for the tree view. The column view is explained here.
Groups
Groups can be used to create a logical structure among the activities in a project.
 Use the Create Group button to create a new group in the active project. A group has a color associated with it, to make the grouping visible in the Kairos view. You can also define a default setting for the billable status for activities created in the group, if enabled.
You can use Groups to group together activities of similar type, like hardware or firmware, or you can group together logical sub parts of the project.
The prefix option in the group dialog helps you automatically number activities created in the group. This will put a prefix like HW1_ before the name of activities in your hardware group. This could be a good idea if you want to reference activities without using their full name. It also makes it possible to have the activities be listed in a logical order rather than in alphabetical order.
The covariance setting is explained in its own chapter below.
You can move elements to and from groups in the same project by drag and dropping, or by changing group with the drop down menu in their respective edit dialog.
Creating a plan
▶ Video reference Manager @ 1:25. 📃 Guide 10 Steps to Create a Project Plan.A project needs activities and milestones to form a plan. These are created in the Kairos view on the right side.
 Double click on a project in the tree view to make it the active project. Make sure Edit Mode is selected in the View options on the right side.
Right click on an empty space in the Kairos view to bring up the element creation palette. Click on the type of element you want to create (or use keyboard a, c, m, r, e or s), or on the X to exit the menu. Selecting an element type will bring up the corresponding creation dialog. If completed the new element will be created both on the Kairos view, and in the tree view.

All the different elements will be explained below.
You can double click on an element to bring up its edit dialog. You can left click and hold to move the element. Left click and hold on an empty area to pan, and use the scroll wheel to zoom.
Click on an element to select it. This will show its connection points as dots. To create a dependency, click on the connection point dot you want to connect. Then click on the element you want to create a dependency with. You can double click on an empty space to exit the connection mode.

To delete a dependency connection, you can double click on it to bring up its dialog, or click once to select and then press the delete key on the keyboard. You can read about advanced dependency options here.
Activities must be directly or indirectly connected to a dependent prio point to be scheduled. You create a prio point from the deadline menu, by checking the appropriate check boxes. Activities not scheduled are displayed with an X. If that is the intention change the activity type to ongoing, to show that it is not a mistake.
Clicking on the + button in the top left corner of the Kairos view brings out a toolbar.

From left to right, these tool buttons are:
 Toggle dark background - The Kairos view can be displayed with a dark or bright background.
 Toggle symbol style - The Kairos view has two modes of displaying symbols. Choose the one you prefer.
 Snap to grid - Moves all elements to its nearest snap point. Elements do by default snap to grid, but you can hold down shift when moving an element to prevent it from snapping.
 Move project to paper center - Move your plan to the center of the Kairos view area.
 The three leftmost buttons are Zoom in, Zoom out and Reset Zoom and Pan. You can also zoom using the mouse scroll wheel.
Keyboard commands
There are a few keyboard shortcuts you can use on the Kairos page when working with plans.
- + Zoom in
- - Zoom out
- w Pan up
- a Pan left
- s Pan down
- d Pan right
- h Reset pan and zoom
- F2 Snap all to grid
- F3 Move plan to center
- i Space in (move all elements towards center)
- o Space out (move all elements away from center)
- arrow keys - move in the tree view
- enter - select in the tree view
- < and > - increase or decrease the width of the tree view column for names
- delete - delete selected item
Click on an element to select it. Hold CTRL when clicking to select additional elements to move. Hold CTRL and left mouse button to select elements using a box.
With an element selected you can use
- w Move selected element up
- a Move selected element left
- s Move selected element down
- d Move selected element right
- t Create dependency from top connection
- b Create dependency from bottom connection
- l Create dependency from left connection on discrete risk
- r Create dependency from right connection on discrete risk
- p Change assigned developer for all selected activities. Opens this dialog.
and as on all pages you can use
- CTRL+R Reload from database
- CTRL+S Run Scheduler
Special commands for element dialogs
In the dialogs described below, you can use special keyboard commands to up your productivity if you are a fast typer. For starters you can use CTRL+S save and exit (or create and exit), or CTRL+Q to abort a dialog.
CTRL+D will take you to the description field of the dialog. Here you can use special commands to fill out the form. Every row that starts with a : followed by a command letter will be treated as a command. Command letters are case insensitive. If it is accepted it will be removed from the description. The commands are applied when you exit the description field, or hit CTRL+D.
:N name - fills out the name field.
:G groupname - selects a group that starts with text.
:@ initials - selects a person with the exact initials, or whose name starts with text.
:W worktype - selects a work type that starts with text.
:B - check the billable box, unless the argument starts with f or false.
:S status - status can be A, C, O or R/CR/CWR for activities, or N, O or F for discrete risks.
:T time estimate - fills out the time estimate. Syntax is described for the activities dialog below. Example 20:40.
:R risk - fills out risk level for discrete risks, 0 to 100 integer.
:P - Checks the prio-pont field for a milestone, unless the argument is f or false.
:D date - fills out a date field. For milestones this also sets the Deadline flag.
:C - check the Checkpoint Approved checkbox for a Checkpoint, unless the argument starts with f or false.
Activities
An activity is a logically scoped unit of work, to be done by one person in one go. It could be one simple task, or a group of small tasks to be done by one person to achieve a goal. Most important is that it is easy to understand what it encompasses and is supposed to accomplish. We recommend not creating too many too small activities, as it leads to more administration and possibly unnecessary micromanagement. Neither should they be to big to grasp and estimate, and unwieldy to schedule when you want to optimize your plan.
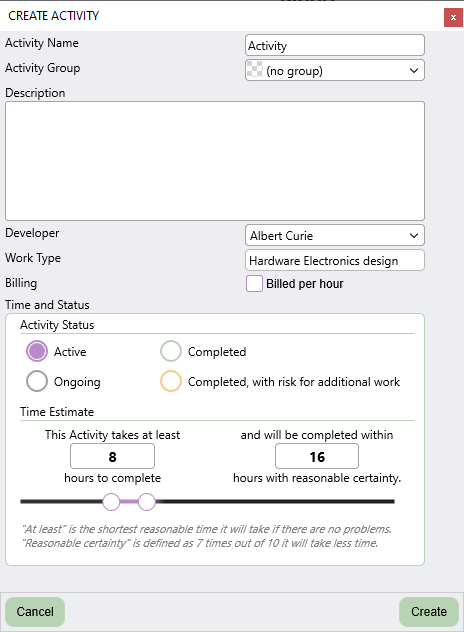
Name and description are important for your team to understand what the activity encompasses. Descriptions can be formatted using markdown code.
Developer is the person scheduled to work on the activity, and the person responsible for updating estimate and status as the project progresses.
Billing and work type are default values used for the activity when creating time reports.
Activity status is one of the following:
 Active: An activity with scheduled work
 Completed: Work completed, and dependent activities can be scheduled.
 Completed, with risk for additional work: This state signals that the work is completed for now, and dependent activities can be scheduled. There may however be additional work that may, or should, be done later. This work is not scheduled, but is still added to the total sum for the project.
 Ongoing: Activities that are not scheduled. This is used for ongoing work, like project management, that does not have a defined end, or cannot be completed in one go. The time is added to the total sum for the project, and is important for budgeting purposes. It is also used for activities in ongoing projects.
Time estimate is an estimate of how much work is required to complete the activity. At least is the time it will take if everything goes without problems. It should be a time that is not impossible to reach, but it should be unlikely that the activity can be completed significantly faster.
The reasonable sure estimate is a time you are reasonable sure will be enough to complete the activity. Reasonable sure is defined as seven times out of ten, it will take less time. The seven times out of ten definition is why it is somtimes denoted as p70, for 70 % probability.
You can enter the time by typing in the text boxes, or by dragging the points on the slider. If you hold down Ctrl while dragging, you move both points at the same time.
You can also use the scroll wheel or arrow keys to change the values in the text boxes. You can change the text of both text boxes at the same time by separating the numbers by :, like 20:40. You can use d and w to enter time as days (= 8 hours) or weeks (= 40 hours) like 2.5d:1w. Entering numbers separated by space or + will add them, like 8+8+4 : 4d+8h. You can express the reasonable sure number as a multiplication of the at least number, like 20:*2.
If you are entering numbers from notes with only an expected outcome estimate, you can create a two number estimate with the specified expected outcome with the E syntax, like E40, or e5d. This syntax will create a reasonable sure estimate that is twice as large as the at least number. You can specify a different ratio like e40*1.5, which is the same as e40*.5.
If the project is not in the Idea state, you change the estimate or status with the Update button, that also creates an Update entry in the project history. This lets you add a comment to the change.
If you have an activity selected when you create a new activity, the group and work type setting will be copied from the selected activity to the create dialog.
Deadlines, Milestones and Prio Points

Choose Deadline in the element creation palette to create any form of milestone. The dialog has checkboxes that determines if the milestone is a deadline, a prio-pont, both, or non of the above.
If no checkbox is selected it becomes a pure milestone. You can monitor the predictions of when it will be reached. It may also be useful to add milestones to manage dependencies a bit easier.
If the milestone is a prio point it will be added to the prio list view, where it can be given a priority. All scheduled projects must have at least one prio point.
If the milestone is a deadline you set a deadline date for it. The PlanMinder will calculate how likely it is that you will reach the milestone before the deadline date.
Checkpoints

The Checkpoint is a special type of milestone. If you need a dedicated person to approve of some work before the project can continue, use a checkpoint in your plan.
The checkpoint has a checkpoint authority who is responsible for the check, and responsible for changing the approved status of the checkpoint.
The checkpoint can be approved before all activities it depends on has been completed. If they are completed, but it has not been approved, it will be shown in the Attention list for the designated checkpoint authority.
External activities

External activities are used to represent things that will take time, but does not require work by the team. This can be work done by external entities, or time to get things delivered.
You assign a supervisor to the external activity, responsible for updating the status, and possibly responsible for initiating the work, placing the order or whatever the external activity represents.
The time it will take is estimated in the same way normal activities are estimated, with the assumption that 8 hours represents one calendar day.
When all activities the external activity depends on are completed, a delivery date will be calculated. This date is used by the scheduler as a predicted delivery date. The supervisor person is tasked with updating the projected delivery date if it is not accurate, and changing the status to completed when delivered.
Discrete Risks
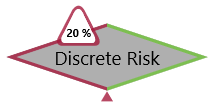
Discrete risks are used to represent risks that will either occur, or not. You define how probable it is that it will fail. This can be used for things like tests that will either pass or fail. A failure would mean that some amount of extra work is required.
The right side of the risk symbol is the pass side. Connect dependencies for if the risk did not fail, or failed and was resolved, from this corner. On the left side create the activities required to resolve the problem if the risk fails. Connect these dependencies back to the bottom dependency connection point.
One person is designated risk manager, tasked with updating risk status and the risk level. If all dependencies for the risk are resolved, the risk will be shown in the attention list for the risk manager.
If risk status is changed to Resolved OK, non of the activities on the fail side will be scheduled. Resolved FAILED will schedule them before any activities on the right side. While not resolved the Monte Carlo simulation will schedule them proportionally to their probability, affecting both timeline and budget uncertainty.
If the discrete risk is resolved before all activities it is dependent on are completed, these activities will no longer be scheduled. They will be marked with an X.
Start Points

If work on a project can not start before a specific date, add a start point to the plan, and make the activities dependent of it. Dependent activities will not be scheduled until the start date has passed.
Copy project elements
Another way to create project elements is to copy them from another project. Select an element in the tree view and drag it onto Kairos work area. This will bring up the create dialog for that type of element, with all fields filled in with the information from the copied element. You can edit all fields just as when creating a new element. The new element will be created where you dropped it. Click Cancel if you do not want to create the element.
Tree view columns

You can change the width of the tree view by dragging the three dot symbol on the divider to the right. This will enable you to see more information in up to six columns. You can click on the Show columns button in the toolbar and choose from predefined column selections, or you can define what you want in each column manually by clicking on the header. (If you want a wider column for the names, use the < and > buttons.)
Hold the mouse over a value to get a hint about the value shown.
This view is good when you want a budget overview. Groups and projects show accumulated information for the entries they contain. If you have defined hour costs for developers you are able to show monetary values as well.
This view is also valuable when checking that you have entered things correctly, and not missed something, when creating a project plan.
Tree view plots

If you drag the divider beyond the rightmost information column, or choose Graphics only from the predefined columns selection, you will get a graphical representation of the time estimates.
The bars represents hours, ending with a box and whiskers plot to indicate uncertainty. The orange bar represents remaining time. By clicking on the filter symbol above, you can enable already done work to be displayed in green. This is similar to the plot shown in the Activity information area on the time report page.
The other option in the filter menu is Highligth selected project. This turns on a background color to make it easier to see which bars belongs to the active project.
Use the scroll wheel to change the scale. Bars that represents a whole project can be difficult to fit in the same scale that make individual activities readable.
Kairos View Modes
▶ Video reference Manager @ 7:31
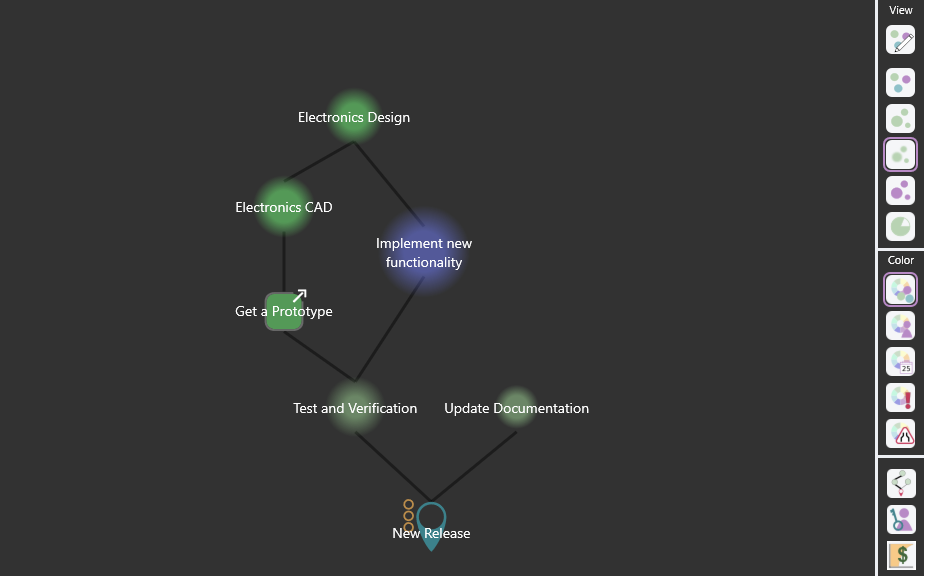
Example of uncertanty view mode with dark mode active.
On the right side of the Kairos view you can select view mode. This changes how your plan is rendered to visualize more information.
 The two top options, Edit mode and Normal mode displays the plan the same way, where all activities are represented by an equally big circle.
 Expected Time makes the activity circle areas proportional to the expected total amount of work. The size used for an activity in normal mode would by default represent 40 hours of work in this mode. This can be changed to 24 or 12 hours by the Activity Reference Size system setting. Completed activities are shown as unfilled circles.
 Uncertainty mode uses a gradient to illustrate the uncertainty in the estimation of total time. The complete solid part represents the minimal time, and the gradient ends with an area representing 90 % probability.
 Remaining Time is similar to Expected Time, but it only shows the time that remains. Completed activities will have no circle at all.
 Progress view mode shows activity circles as a pie chart. The area of the circle represents the expected total time. The filled in part of the circle represents the remaining time.
These view modes can help you get a quick overview of the nature and status of the project.
Kairos Color Modes
There are five coloring modes for the Kairos view.
 Color by Group. The top default option is to color activities and external activities by the group they belong to. If they do not belong to a group they get the standard green color.
 Color by Developer uses the designated color for the developer responsible for the activity. This gives a quick overview of who does what, and who will have the most work. A legend will be displayed at the bottom. Double-click on the legend to change assigned developer for all selected activities. (Shortcut key p.)
 Color by Expected Done Date uses a gradient to illustrate how far into the future activities are expected to be finished. Warmer colors are closer in time. A legend at the bottom explains the colors. You can combine this with a tree view column to get exact dates.
Combining view modes with different color modes unlocks visualizations that can give you a good feeling for the project, and let you discover anomalies and mistakes.
The last two color modes are for analysis tools that require some computation.
 Color by Criticallity Analysis runs an analysis for a selected prio-point milestone. Activities and external activities are colored based on how critical they are for when the milestone will be reached. Specifically the analysis tests how much on average one extra day of work for an activity will delay the milestone using Monte Carlo simulation based analysis. If the milestone on average will be delayed one day the activity will be given a criticality score of 100%, as it definitely is part of a critical path, and it will be colored red. If it does not affect when the milestone will be reached it will be colored blue.
Only activities and external activities that are part of the project, and that the milestone is dependent of, will be included in the analysis. Activities part of the fail path of a discrete risk are not included.
 Color by Bottleneck Analysis runs an analysis for a selected prio-point milestone to find bottleneck activities. All activities the milestone is dependent on, and all activities connected to prio-points with higher priority are included in the Monte Carlo simulation based analysis. This mean that many activities may be included and that the analysis can take some time.
The analysis test what would happen if an activity is reassigned to the imaginary user, who is always available for scheduled work. How many days (excluding weekends and holidays) this on average would move the milestone completion is recorded. The change is compared with the amount of scheduled work for the activity to calculate a score.
A score close to zero percent mean that reassigning the activity has little or no effect on when the milestone will be reached as the project is currently scheduled. Scores around 100 % (usually) mean that the activity is part of a critical path that could be done in parallel if reassigned. Scores significantly above 100 % denotes true bottlenecks, where a small change in the plan could have a big effect on the completion date.
You may find that activities and persons involved in higher priority projects affects your milestone more than anything you can do in your project. You may also get negative scores for some activities. That mean that a higher priority project would be more optimized, removing a gap in the planning your project currently is utilizing.
The bottleneck analysis dialog will remain open when the simulation is completed. If you close it and open it again, you can see the result of the last analysis. You can double click on a row to close the dialog and select and highlight the corresponding activity.
General notes on the analysis tools
Scores are calculated using Monte Carlo simulations, which mean that there is an amount of uncertainty and randomness to the values. If you select the Fast Mode option, the simulation will run fewer iterations an be significantly faster, but also less precise. You can observe how much values changes between two identical runs.
The results you get are dependent on the current schedule. Even a small change can have a large impact. When working to optimizing plans, rerun the simulation after every change to see what has become critical in the new situation.
To understand why an activity is a bottleneck or has a high criticality score, and to find the best way to optimize, do look at the schedule in Chronos view. Compare different analysis tools, including Key Person analysis explained below, and try one change at a time. Use Scenario Mode to experiment without upsetting the active plan. All three analysis tools are available in the Chronos view too.
Critical Path
 Critical path is the longest sequence of tasks that must be completed to reach a milestone. This path is displayed by making the dependency lines thicker, and the expected amount of work on this path is displayed. Activities part of the fail path of a discrete risk are not included.

Example with Critical Path and Color by Criticality Analysis active.
The path and the value are purely theoretical and does not take into account how activities have been assigned or the availability of the developers. Critical Path can be shown for projects not yet scheduled. When you schedule the project you will get much more useful information on when it will be completed, and can use the Color by Criticality and other analysis tools to find what activities and persons actually are critical for when the milestone can be reached.
Key Person Analysis
 This analysis explores which person is most important for when a selected prio-point milestone will be reached. It does that by testing how a 10 % increase in schedulable time for a developer would affect the completion date for the milestone. If the increase improves the completion date 10% the developer is given a 100 % score. The analysis includes all higher priority projects, so the most critical person may be one not directly involved in the analyzed project.
The Key Person Analysis tab in the dialog shows the calculated scores and the median amount of work required by the person to reach the milestone, both in the project and a total sum including higher priority projects.

The assigned work tab shows information about the distribution of work between developers. Both in the project for the activities the selected milestone depends on, and for all activities including those in projects with higher priority. This is another measure of who the key persons are.
The Scheduled Work Types tab shows similar information but for how the work is distributed on different work types. This may help you identify what kind of competence is needed if you are going to extend your project team. (The Reports / Explore tab is another tool you can use to explore Work Type distribution both historically and in future plans.)
Cost probability distribution
 When you click the "Show cost probability distribution" button, a new plot window will open. This plot shows the result of a Monte Carlo simulation for the project cost.
On the Y axis you have different probability levels and ond the X axis cost of work.
You can read out how likely it is that the project work will cost less than where bars end. Orange bars represents work left to do, including ongoing activities and other work that is not scheduled. Green bars represent work already done and reported.

The cost unit is the currency defined in System / System Settings. The cost per hour is defined in System / Hour Costs. The cost for work already done is based on the hour cost set at the time the work reports were created.
In the example plot above you can read out that there is a 70 % chance that the cost will be below 250 (units). Holding the mouse over a bar will display the exact values.
Project Live View - for project planning meetings
 The Live View button opens a new window showing the active project. Unlike the Kairos page, it will automatically update when anyone makes a change to the project.
The intended use is for project planning meetings, where a whole team is cooperating to make and refine a project plan. Put this window on a shared screen while the team discusses, adds to, and edits parts of the plan on their own computers. If you set All Developers as Deputy Project Manager in the project settings, all participants can take part in the creation process.
The Live View window is intended for presentation, not for editing. You can right-click on elements to bring up the description overview, but you cannot create new elements in this window.
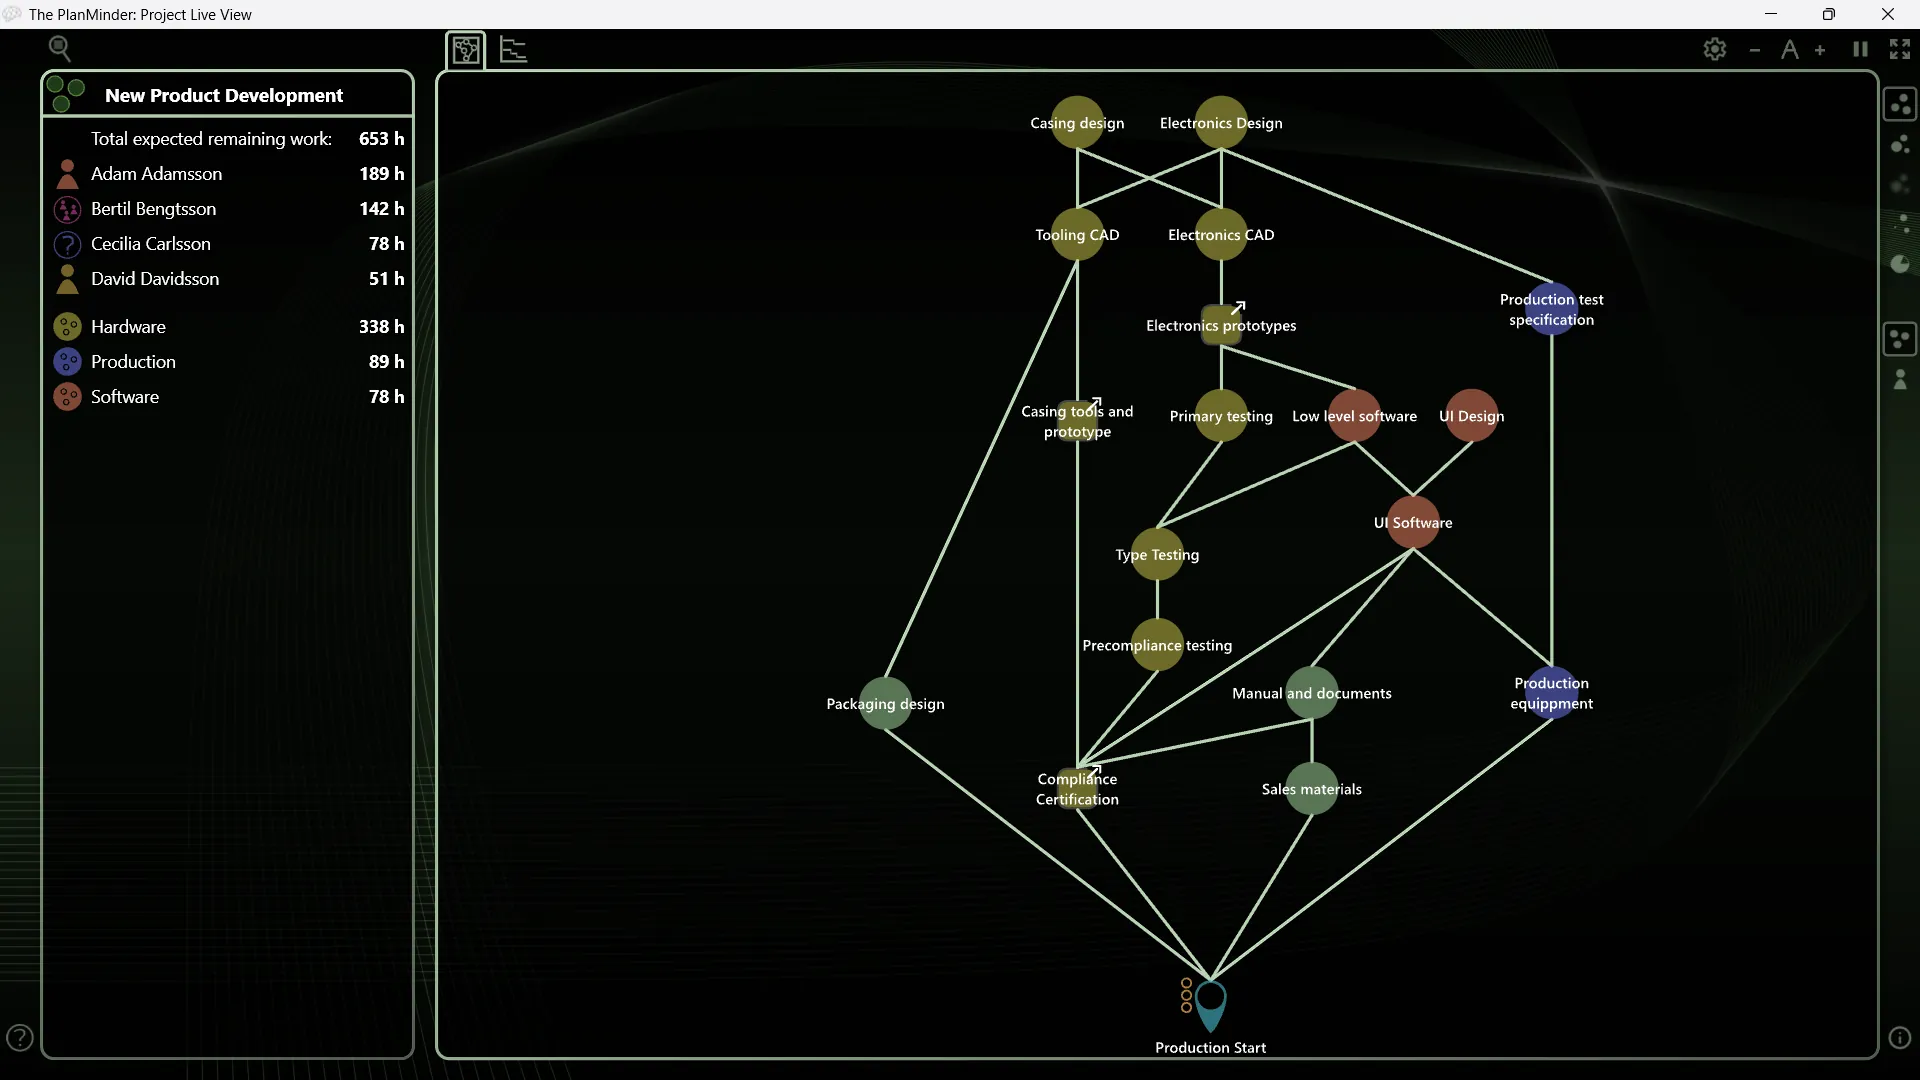
On the left side assigned developers and top-level activity groups are listed, along with the total expected (remaining) work, sheduled and unscheduled.
The visual appearance of the Live View window can be changed. See the chapter on the similar Presentation View window for details and keyboard shortcuts.
 The Zoom All button on the top left adjusts the view to show the whole plan. Unless you manually zoom or pan, the window will adjust to show all after each reload.
The Group Covariance Setting
In the dialog box for activity groups you find a setting for covariance. The Covariance setting is a way to fine tune the uncertainty model for the project. The default value is 20 %. This is a reasonable value in most cases, and if reasoning about mathematical models is not your cup of tee, then you can confidently leave it there.

In probability theory covariance is a measure of the joint variability of two random variables. When modeling the uncertainty in the estimated time for activities, they are considered random variables. If they are independent, like rolls of a die, the covariance is zero.
When regarding how much time activities will take compared to the estimates, you can not always assume that they are independent. There may be a common problem that will affect all or many activities. Or you may be equally bad at estimating all activities, so that they all tend to be over or under your guess.
In The PlanMinder groups are used to model covariance between activity estimate errors. The covariance is between all activities in the group, but only activities in the group.
Underestimating the covariance leads to an underestimation of the uncertainty for the whole project and its milestones. That is why it is included in the model. The default value of 20 % is arbitrarily chosen, but it is a reasonable value.
If you know more, you can change the covariance. If you are certain the activities are independent from each other, set it to zero. If you are aware of risks common to many of the activities in the group, set it a bit higher. 100 % covariance would be equivalent to having one dice role dictate the outcome of all activities. This is unlikely in practice.
You may also actively choose to group activities that are similar, and where you expect a covariance to exist, to get a better project model.
Covariance is more important for larger projects, and when you have long planning horizons.
Advanced dependency options
When you double click on a dependency between two activities, a dialog containing advanced options opens. Normally you should not use these. They make the plan harder to read and understand.
There are however situations when you may want to use them to fix scheduling problems, instead of splitting an activity into two.

Normally a dependency mean that one activity needs to be completed before work on the dependent one can start. If you enter a number in the “Hours of independent work after start“ field, some amount of work can be done before you need the result of the first activity.
The second field “Independent hours of work” indicates that the first activity does not need to be completely finished for the dependent activity to start. The number you enter represents the amount of work allowed to be left in the first activity when work on the dependent activity can start.
Dependencies with advanced options are color coded as shown in the image above.
These are powerful options to fine tune the model of the project and make The PlanMinder schedule tasks as you intend. They are also difficult to understand, easy to forget and might therefore produce surprising results. They are best used to adjust the scheduling behavior in near time, but best avoided when first creating a plan.


