Why Percent Complete Is a Bad Project Metric
Reflections on common project report practices.
Percent Complete is a common metric on standard project report templates. Either for the project as a whole, or for individual milestones. I will explain why this is a bad metric.
RAG- or traffic light status with a red, amber or green color signal is also commonly used on project reports to signal if a project or milestone is on time and budget or not. While simple, this system also has issues. We will discuss how to do better.
The Problems With the Percent Complete Metric
Definition: Percent complete = work done / total amount of work.
It hides the scale and remaining work
The percent complete metric compares something you cannot do anything about with something you do not know for sure. By itself it gives you no actionable information. Even with context it will only promote the sunken cost fallacy.
The stated main purpose of a project report is usually to give summarized information to executives so that they can decide if some form of action is needed, or if the project should continue without any changes to resources, goals or budget.
This metric removes the scale of the project. 10 h / 20 h = 1000 h / 2000 h. Without the context of scale does it give you any useful information?
It compares the uncertain with the unchangeable
Work done is something you cannot do anything about. Whatever decisions you make on your executive meeting, those hours of labor are never coming back. The total amount of work is something you can only guess. As the project progresses you should gain more information and be able to guess more accurately than before work started. Thus, total amount of work could increase. If the percent done metric is unchanged between two reports, is that because no work has been done or because total amount of work has increased? That information is lost in the division.
An even worse version of % Complete is where you divide completed “things” over total number of “things” to accomplish. A well known rule of thumb for software development is that the last 10 % takes half the time.
What you should report instead
What you should write in your report instead is the estimate of how much work and costs remains, and if the expected value of the result has changed.
RAG traffic light signaling
The Red, Amber, Green signaling system sounds like a good idea. It is clear, and lets busy people focus on problem areas where attention is needed. And in a sound environment it can work just fine.
Project managers are humans
Project managers are also humans. How likely they are to put a non green signal on the report corresponds with what will happen when they do. Or rather what they expect will happen.
If a pat on the shoulder for being observant and diligent, followed by some actual help to evaluate and resolve the problem, is the norm; then the RAG system can work.
If you expect:
- disappointment,
- questioning about how this could have happened and who's to blame,
- questions about how you are going to solve it,
- closely monitored action lists and extra micromanagement,
… then maybe you will wait to put the red signal on the report until it is evident and unavoidable. That may be at a time when it is too late to take any corrective measures.
On online forums you may even find the advice that if you work on a project with the RAG signaling system; “continue to signal green and start looking for a new job”. By the time the red signal becomes unavoidable, it's someone else's problem. It is not an advice I endorse, but it is a testament that regardless of what actually follows on a red or yellow signal, the expectation might be that nothing good will come out of it.
Optimism is great, but not for accuracy
You, of course, are an honorable project manager that would never willfully deceive anybody in your project reports. However even you may prefer to believe in your team and hang on to the possibility of things magically working out as long as there is a chance. A red signal would make people worry, and you do not want to worry people unnecessarily. So its best for everybody if you stay an optimist for a while longer. Right?
What to do instead
What to do instead? Better alternatives do exist, but it is difficult to improve much without the help of a tool. That is why it is time to talk about The PlanMinder, and how uncertainties and probabilities give you much more information and earlier warnings.
How The PlanMinder Helps You With Project Reports
Better insight for executives
As an executive reading reports The PlanMinder gives you access to much more and better information than the standard report template would.
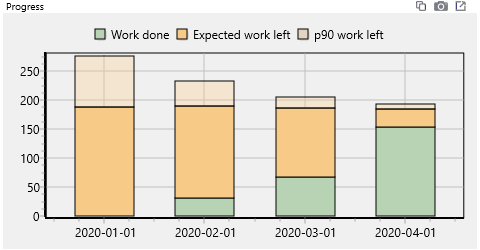
You can have a RAG-field in the report if you really want to, but you can also view more detailed predictions for when milestones are likely to be reached, and the range the total amount of work might end up in. Not as a single decision of what the project manager wants to tell you, but as an accumulated effect of all estimates for all activities.
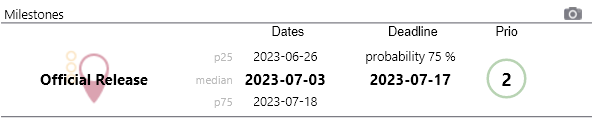
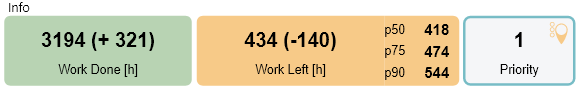
The PlanMinder has automatically generated fields for how much work remains at different probabilities, and how much work already has been put into the project. For each milestone you can see when they are likely to be reached at different probabilities, and how they currently are prioritized. If there is a deadline you can see how likely it is that it will be reached on time.
The project reports element structure lets you quickly show the elements you are interested in for all projects. You can then dig deeper where you have concern. You can select one project and see the history and discern trends and patterns over time in the reports. And you have access to all other historical data and tools just as the project manager has, if you want to investigate further. Both in the history and in the planned future.

When it comes to taking action, Scenario Mode and the ease with which plans and priorities can be changed lets you (or the project manager) test the effect of different alternatives before making a decision. Not only on the project in question, but on all projects in The PlanMinder that share resources.

Faster, more accurate reporting for project managers
As a project manager the Project Reports function in The PlanMinder helps you to create a report faster. The last report is used as a template, and many fields are automatically filled in with information The PlanMinder keeps track of.
When writing the free text parts of the report, you are helped by the other tabs on the Reports page to find out what has happened since the last report. The follow up tab lets you see where time has been spent, and read time and activity reports. Activity reports shows when estimates or status has been changed, and if used correctly with an explanation of why. The explore tab lets you do more specific and detailed analysis if necessary.
The PlanMinder also includes a presentation mode that lets you hold a beautiful, interactive presentation without creating slides. You can even load the official company PowerPoint template as the background.

Learn from history to improve future projects
While informing executives and stakeholders often is the primary reason for writing project reports, they may have other uses too.
If you want to learn from your mistakes and successes, the history of project reports can be your first source of information. Memory tends to be subjective, so having factual records improves the chance of drawing correct conclusions.

Even if nobody else were to read the project report, there is value in the act of writing it. It provides an occasion to reflect on the bigger picture, review risks, issues and things postponed to be resolved later. To tidy up plans, documentation and to make sure you are not forgetting something important.
Related Articles
Continuous Project Planning - Core Concepts
When to Plan and When to Scrum?
Project Portfolio Management for R&D and Product Development